 g/1 of chlorate. From this point, make-up solution of 150 g/1 was added until the concentration dropped to 100 g/1. Then solution adjusted to the chlorate composition of the electrolyte was added until the completion of the experiment.
American Potash & Chemical Corporation, Whittier, California
Cell construction:— Laboratory cells were constructed of 1/8in. Lucite. They were cylindrical in shape, 2.5in. I.D. x 5in. high. The electrodes, a thermometer, and a 0.25in. diameter x 1.5in. gas outlet tube were sealed through the cell cover. A rubber gasket was fitted to a 0.5in. flange around the top of the cells. Wing nuts through the flange secured the cover, creating a gas-tight fitting.
Evolved gas was directed to 50 ml burets. Volumes were measured by the displacement of water in the burets.
Electrolyte levels in both cells were maintained 1 in. from the top; this gave a small equal volume. Electrolysis time, while the gases were being collected, was short. Since a ratio of volumes was utilized, no corrections for pressure and temperature were necessary; it was assumed that the burets remained under identical conditions, even though volumes of different magnitude were involved.
Lead dioxide was employed as the anode in the laboratory cell except for the initial experiments. A Pt anode was used in these experiments to establish reference data. Two cathodes connected in parallel were used. The initial concentration of the electrolyte was approximately 500 g/1 of reagent grade NaClO3 with various additives. New electrolyte was used for each series of experiments.
Temperatures of both cells were controlled with external water cooling within 5°C.
Experimental procedure:— The coulombic and laboratory cell were connected in series to a Se rectifier. Current and voltage across the laboratory cell were measured during electrolysis. These cells were operated until the coulombic cell had evolved 50 ml of gas. Comparison of this volume to that evolved from the laboratory cell gave the current efficiency. Each experiment was made under a controlled current density. The pH of the electrolyte was controlled within a given range and was adjusted with HCl or NaOH.
The cells were operated a sufficient length of time after reaching thermal equilibrium to purge the dead air space. During this time gas was evolved to the atmosphere. When a steady rate of evolution existed, the gas was collected in the burets and data recorded during the collection of the gas samples. Current was varied from 1.33 to 5.30 amp. while the voltage across the laboratory perchlorate cell covered the range of 4.0-6.1 v. A temperature range of 20C-40C was investigated.
Table 1. experimental results of laboratory perchlorate cells
| Anode | Cathode | Anodic current Density | Voltage | Current Amps | Temp. range C | pH | NaClO3 g/l | NaF g/l | Na2Cr2O7 | Current* efficiency(%) |
|
Pt |
Carbon steel |
31.0 |
5.2 |
2.90 |
20-25 |
6.0 |
484.5 |
— |
5 |
92.8 |
|
PbO2 |
Carbon steel |
15.5 |
4.6 |
2.46 |
30-35 |
6.5 |
484.5 |
— |
5 |
37.7 + |
|
PbO2 |
Copper |
15.5 |
4.4 |
4.71 |
30-35 |
6.0 |
484.5 |
— |
5 |
36.3 |
|
PbO2 |
Copper |
15.5 |
5.0 |
1.47 |
35-40 |
6.5 |
500.0 |
0.5 |
— |
92.4 |
|
PbO2 |
Nickel |
7.25 |
4.0 |
1.33 |
35-40 |
6.5 |
500.6 |
0.5 |
— |
93.5 |
|
PbO2 |
Nickel |
15.5 |
5.0 |
1.47 |
35-40 |
6.5 |
493.5 |
— |
— |
84.8 |
|
PbO2 |
Nickel |
15.5 |
5.0 |
1.47 |
35-40 |
6.5 |
493.5 |
0.5 |
— |
92.3 |
|
PbO2 |
Nickel |
15.5 |
5.3 |
1.47 |
35-40 |
6.5 |
493.5 |
1.5 |
— |
92.7 |
|
PbO2 |
Nickel |
15.5 |
5.2 |
1.47 |
35-40 |
6.5 |
493.5 |
Saturated |
— |
93.0 |
|
PbO2 |
Nickel |
15.5 |
4.9 |
2.65 |
35-40 |
6.5 |
500.6 |
0.5 |
— |
93.7 |
|
PbO2 |
Nickel |
23.25 |
5.8 |
2.21 |
35-40 |
6.5 |
493.5 |
0.5 |
— |
92.7 |
|
PbO2 |
Stainless steel (302) |
31.0 |
6.1 |
5.30 |
25-30 |
6.5 |
495.2 |
0.5 |
— |
97.5 + |
* Approximate instantanous current efficiency based on gas collection technique
+ Discoloration of evolved cell gases during electrolysis inducated that side reactions were taking place.
Conclusions:—Examination of the data in Table I indicates that the following conclusions may be made:
1. Sodium perchlorate can be made by electrolysis using a Pb02 anode with Cu, carbon steel, Ni, or stainless steel cathodes.
2. Current efficiencies appear to be higher with Ni, stainless steel, and Cu cathodes than with carbon steel.
3. Data obtained with carbon steel are not conclusive because of side reactions.
4. Sodium fluoride appears to be a better additive than sodium dichromate. The minimum effective NaF concentration is 0.5 g/1.
5. Data obtained with a PbO2 anode. Ni cathodes, and a NaF additive indicate that the current efficiency is practically independent of current density, temperature, and pH in the range of variables investigated. An instantaneous current efficiency of 93.7% was obtained at an anodic current density of 15.5 amp/dm squared. (155mA per cm squared).
6. Lower voltages appear to be possible using PbO2 anodes.
The first phase of the investigation had set up sufficient design criteria to proceed with the construction of a larger unit which could be operated semicontinuously and for longer periods of time. All the variables could be evaluated based on the current efficiency, which could be determined by a direct chemical analysis. In order to proceed with this unit, larger Pb02 anodes were made.
Bench-scale cell construction:-The cell was a 4-liter resin reaction kettle with a bottom outlet (Fig. 1). Current was provided by a Se rectifier
 and voltages and current measurements obtained. Temperature was controlled by circulating water through a glass coil immersed in the electrolyte. When pH control was necessary, 18% HC1 was added.
The anode consisted of a rod-shaped, rough surfaced Pb02 electrode and was immersed in solution so that, at a current of 26 amp, the anodic current density was 15.5 amp/dm squared. This value was maintained constant in all experiments. It proved to be the best value obtained in the smaller laboratory cells and simulates approximate plant operating conditions. Cathodes were U-shaped metal rods of varying diameters by 15 in. in length. The anode, cathodes, cooling coil, and thermometer were inserted through the top of the cell into the electrolyte. An electrical connection was made at the top of the anode with a Ag-plated Cu clamp. Cathodes were on 3 in. center to center spacing, with the anode centered between them or 1.5 in. from the cathodes. Figure 2 is a picture of a typical Pb02 anode with the cathodes used.
Electrolyte could be removed from the bottom of the cell and returned to the top to insure adequate mixing.
Experimental procedure:-At the start, the cell was filled with 4 liters of solution containing approximately 500 g/1 NaC103 plus the additive. The pH and temperature were recorded. A value of 6.9 was considered to be the maximum limiting pH while the temperature was controlled within the range of 30-45C. Current was adjusted to the desired anodic current density, and voltage noted.
Electrolyte was removed during electrolysis from the bottom of the cell and returned through the top. About 2 liters were removed in from 2 to 3 min in 500 ml increments. This served to keep the electrolyte well circulated and was repeated every half hour. After recirculation was completed,\a 100 ml sample was secured and the pH measured. This sample was returned to the cell and the pH adjusted, if necessary.
A 15 ml sample was taken for chemical analysis every 2 hr after recirculation. Then 15 ml of makeup solution were added to maintain constant volume.
The addition of make-up solution is important, since no drastic concentration changes in the electrolyte could be introduced. During the initial phases of the experiment the make-up solution contained 300 g/1 NaC103. This solution was used until the concentration of the electrolyte in the cell dropped to 150
g/1 of chlorate. From this point, make-up solution of 150 g/1 was added until the concentration dropped to 100 g/1. Then solution adjusted to the chlorate composition of the electrolyte was added until the completion of the experiment.
Every 2 hr a 15 ml sample was analyzed immediately for its sodium chloride and chlorate concentrations. Since the perchlorate determination was time consuming, samples were taken only every 4 hr for analyses.
Experiments were carried out for 52 hr continuously, except when side reactions or chlorate analyses indicated that the obtained efficiencies were too low.
A typical result, using Ni cathodes, illustrating the change in electrolyte concentration as a function of time and the cumulative current efficiency is presented in Fig. 4. Figure 5 presents results with stainless steel cathodes.
Sodium perchlorate produced in these bench-scale experiments was converted to ammonium perchlorate to determine purity and for evaluation purposes. Only the first crop of unwashed crystals was selected for chemical and spectrographic analyses. Table III presents spectrographic data on the ammonium perchlorate prepared, and indicates that no unusual quantity of metallic impurities was introduced into the perchlorate.
Conclusions:- The following conclusions may be reached from the experimentation, utilizing PbO2 anodes as a substitute for Pt in the production of sodium perchlorate:
1. Lead dioxide anodes produce sodium perchlo rate at high cumulative current efficiencies.
2. The cumulative current efficiency for a given anodic current density is a function of chlorate con centration, the cathode material, the cathodic current density, and the additive used.
3. The wire on which the PbO2 was plated for an anode appears to have no effect on the production of sodium perchlorate.
4. Sodium perchlorate can be produced using cathodes of Ni, Cu, stainless steel, and carbon steel. However, efficiencies with carbon steel are very low.
5. Sodium dichromate has a detrimental effect on current efficiency by forming a thin deposit on the surace of the PbO2 anode.
6. Decreasing the cathodic current density increased the current efficiency when utilizing Ni and stainless steel cathodes.7. One Pb02 anode was used in the cell operation for 3,000 hr.
8. Ammonium perchlorate was prepared from the sodium perchlorate produced in these experiments. No unusual metallic contamination was present and the ammonium perchlorate meets present commercial specifications.
9. Comparison of energy requirements calculated for identical experimental conditions indicates that Ni and stainless steel are the best cathode materials and that PbO2 offers energy advantages over Pt as an anode.
10. Energy results of 1.04 kw-hr/lb of sodium perchlorate with a cumulative current efficiency of 91.5% were obtained. These results were attained with stainless steel cathodes at a cathodic current density of 7.25 amp/dm squared and a final sodium chlorate concentration of 50 g/1.
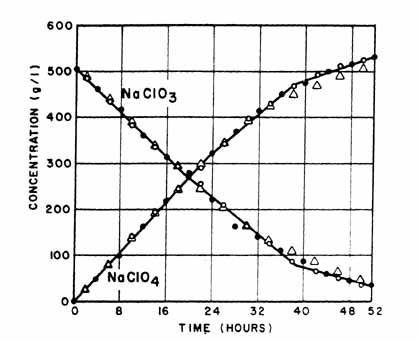 |
Fig. 3. Effect of PbO2 conductor wire. Electrolysis conditions: anodic C. D. = 15.5 amp/dm sqr. cathodic C. D. = 7.25 amp/dm sqr.; temp. range = 30°-45°C; cell voltage = 5.2-5.3 v; pH = 5.2-5.7; NaF conc. = 0.5 g/l. Anode: solid circle Pb02 plated on Ni wire; open circle, PbO2 plated on Pt clad Ta open triangle, Pb02 plated on Ni wire. |
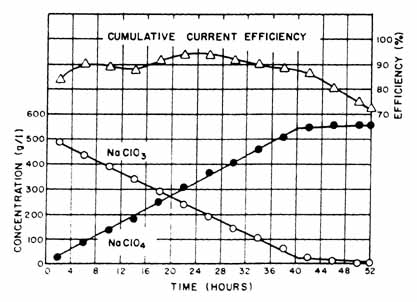 |
Fig. 4. Effect of nickel cathodes on cumulative current efficiency. Electrolysis conditions: anodic C. D. = 15.5 amp/dm sqr.; cathodic C. D. = 7.25 amp/dm sqr.; temp, range = 35°-45°C; cell voltage = 5.0 v; pH = 5.3; NaF conc. = 0.5 g/ I; anode: rough surface rod-shaped, 2.06 cm dia. x 45.72 cm long; cathode: two U-shaped Ni rods, 0.95 cm dia. x 38 10 cm long. |
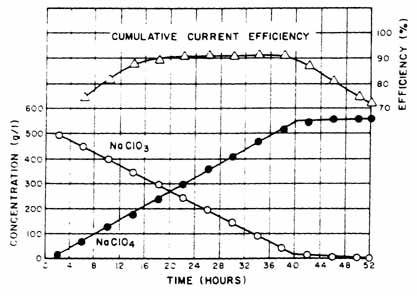 |
Fig. 5. Effect of stainless steel cathodes on cumulative current efficiency. |
| Table II Experimental results of bench scale production cells | ||||||||||
|
Cathode |
Cathode cd |
Additive |
Voltage |
Current a |
Time. |
Kw Hr |
Final b NaClO4 NaClO3 |
Cumulative ce |
Unit energy c |
|
|
Nickel |
21.4 |
NaFd |
5.1 |
26.0 |
41.6 |
5.51 |
510 |
50 |
83.0 |
1.23 |
|
Nickel |
21.4 |
NaF and |
5.3 |
26.0 |
52.0 |
7.16 |
240 |
280 |
31.1 |
3.38 |
|
Nickel |
7.25 |
NaF |
5.0 |
26.0 |
38.6 |
5.02 |
514 |
50 |
88.2 |
1.11 |
|
Stainless (302) |
21.4 |
NaF |
5.2 |
26.0 |
49.2 |
6.52 |
493 |
50 |
68.0 |
1.50 |
|
Stainless (302) |
7.25 |
NaF |
4.75 |
26.0 |
37.6 |
4.64 |
505 |
50 |
91.5 |
1.04 |
|
Stainless (302) |
7.25 |
NaF and |
4.75 |
26.0 |
24.0 |
2.96 |
235.5 |
287.6 |
66.0 |
1.43 |
|
Copper |
21.4 |
NaF |
5.7 |
26.0 |
42.8 |
6.36 |
492 |
50 |
78.5 |
1.47 |
|
Carbon steel |
21.4 |
NaF |
5.1 |
26.0 |
52.0 |
6.89 |
264 |
214 |
34.2 |
2.96 |
|
Carbon steel |
14.1 |
Na2Cr2C7 g |
4.9 |
26.0 |
48.0 |
6.13 |
68 |
445 |
9.9 |
10.23 |
| a Anodic cd = 15.5 amp/dm squared b Volume = 4 liters c Commercial production requires 1.5-1.9 kW-hr/lb at 6.2 to 6.8 Volts and Anodic cd of 31.1-52 amp/dm squared d NaF as an additive =0.5g/l concentration e Na2Cr2O7 concentration 0.5 g/l f Na2Cr2O7 concentration 0.003 g/l g Na2Cr2O7 concentration 5.1 g/. | ||||||||||
| Table III Spectrographic analyses of unpurified Ammonium Perchlorate | |||
|
Cathode material |
Nickel |
Stainless steel (302) |
Copper |
|
Major constituent* ** |
Sodium |
Sodium |
Sodium |
|
Intermediate constituent |
Potassium |
Potassium |
Potassium |
|
Minor constituent |
Approximate % |
Approximate % |
Approximate % |
|
Calcium |
0.10 |
0.10 |
0.10 |
|
Aluminum |
0.05 |
0.05 |
0.01 |
|
Iron |
0.05 |
0.01 |
0.005 |
|
Magnesium |
0.01 |
None found |
None found |
|
Silicon |
0.01 |
0.01 |
None found |
|
Barium |
0.01 |
0.01 |
0.01 |
|
Chromium |
0.005 |
0.001 |
0.001 |
|
Copper |
0.005 |
0.01 |
0.005 |
|
Vanadium |
0.005 |
0.001 |
0.001 |
|
Nickel |
0.005 |
None found |
None found |
|
Manganese |
0.001 |
None found |
None found |
|
Lead |
0.001 |
Trace |
Trace |
|
Wt of Ash (g) |
1.62 |
1.39 |
3.03 |
| *Mother liquor hold-up **Based on Spectrographic analyses of ash | |||
Manuscript received May 6, 1957. This paper was prepared for delivery before the Washington Meeting, May 12-16, 1957.
Any discussion of this paper will appear in a Discussion Section to be published in the December 1958 Journal.
REFERENCES
1. G. Angel and H. Mellquist, Z. Elektrochem., 40, 702 (1934) (Ger. 140,317; 195,117; 206,329).
2. Y. Kato and K. Koizumi, J. Electrochem. Assoc. Japan, 2, 309 (1934).
3. K. Sugino and Y. Shibazaki, ibid., 16, 9 (1948).
4. K. Sugino, Bull. Chem. Soc. Japan, 23, 115 (1950).
5. F. Foerster, Z. Elektrochem., 4, 386 (1898).
6. W. Oechsli, ibid., 9, 807 (1903).
7. J. G. Williams, Trans. Faraday Soc, 15, 134 (1919).
8. N. V. S. Knibbs, ibid., 16. 402 (1921).
9. C. W. Bennett, ibid., 29, 323 (1916).
10. N. H. Furman, "Scott's Standard Methods of Chemical Analyses," Vol. 1, p. 272-275, D. Van Nostrand Co., Inc., New York (1950).
11. C. L. Mantell, "Industrial Electrochemistry," 3rd ed., p. 135, McGraw-Hill Book Co., Inc., New York (1950).
HIT THE BACK BUTTON ON YOUR BROWSER